

Simpson students report satisfaction with college
October 16, 2019
On Oct. 4, the Student Government Association sent students, faculty and staff the results of the 2019 Simpson College Student Satisfaction Inventory.
The survey took place from Jan. 28 to March 21. Students were prompted to rate varying aspects of their college. The ratings of said aspects are meant to indicate their level of importance to the students, as well as how satisfied students are with them.
According to the report, “Reported scores consist of the average importance rating, means and standard deviations for satisfaction ratings, and the resulting gap between importance and satisfaction.”
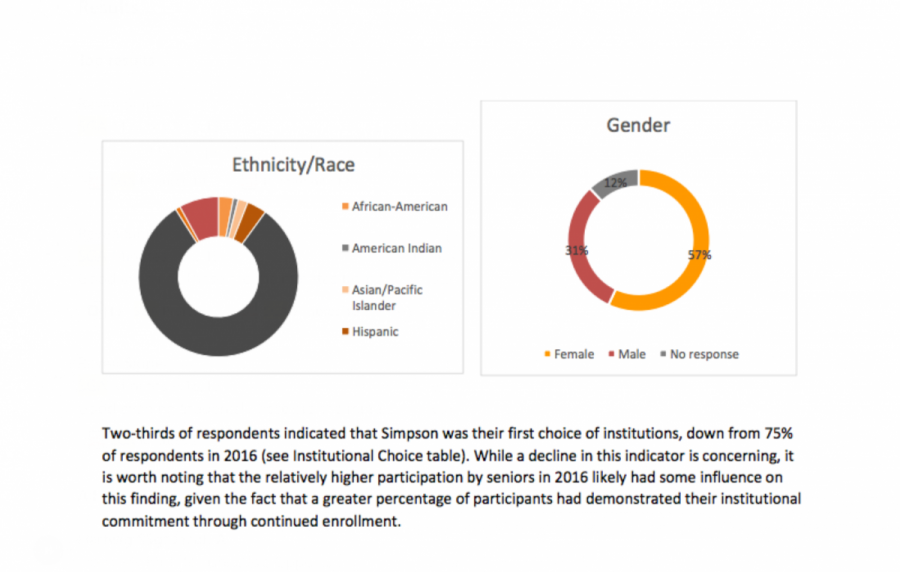
The category “Institutional Choice,” for example, measures how often a school is a student’s first, second or third choice. In Simpson’s case, this category drew comparisons between 2016 and 2019 results. While there was growth in selection as students’ second and third choice, Simpson experienced a nine percent drop as a “first choice” school in the last three years.
“While a decline in this indicator is concerning,” the report said, “it is worth noting that the relatively higher participation by seniors in 2016 likely had some influence on this finding, given the fact that a greater percentage of participants had demonstrated their institutional commitment through continued enrollment.”
There were several factors that influenced enrollment. Like the 2016 survey, respondents indicated cost and financial aid to be the largest factor in the college selection and enrollment process.
“Noteworthy changes from 2016 to 2019 on this item include the decline (from 91-percent – 87-percent) in academic reputation and increase (34-percent to 52-percent) in the opportunity to play sports as reasons to enroll,” the report said.
At the end of the report, in a table titled “Strategic Summary” there is a list of Simpson’s strengths and the challenges facing Simpson according to the participant data.
“Items included in this summary are those which students rated as most important; strengths are high importance/high satisfaction items and challenges are high importance/low satisfaction,” the report said.
Among the strengths listed, the consensus seemed to be students found the academic quality and connections to advisors, faculty, and staff at Simpson to be of high importance and high satisfaction.
“On almost every strengths item Simpson students reported higher levels of satisfaction than students at peer institutions,” the report said. “In considering how to maximize on these strengths, particularly related to students’ academic experience, it would be worthwhile to consider how this can be leveraged in order to increase academic reputation as an enrollment factor.”
Among the challenges listed, students reported lower satisfaction in high importance areas such as whether the institution is concerned with students as individuals, whether being a student at Simpson is an enjoyable experience and whether students feel a sense of belonging.
“Institutional challenges involved safety, cost-related factors, residential facilities, and commitment to racial harmony,” the report said.
No clear indication of action, or recommendation of action, on behalf of the college addressing these challenges was written in the report.
Simpson students report low satisfaction with campus security, diversity and cost, among others.
The report also disclosed demographic information about the student body taking the survey. Of the full-time, traditional students who were solicited for participation, a total of 367 completed the survey, a seven percent increase in respondents.
According to the report, there was an over-representation of first year students and an under-representation of seniors, with the former yielding a 31-percent response rate and the latter yielding 18-percent.
The report went on to say this gap might be, “an artefact of one incentive involving a “bump” in participants’ 2019-20 housing lottery number.”
Sophomores and juniors, on the other hand, had a closer response rate. 25-percent of respondents were in their second year, while 26-percent were in their third.
“Review of response trends according to identified ethnicity/race showed that students of color expressed higher levels of satisfaction, including regarding institutional focus on issues related to diversity and inclusion,” the report said. “Future administrations should include as institutional demographics, if they have not by then become standard demographic items, broader options for gender identity and sexual orientation.”